Data set one: Interest Inventories
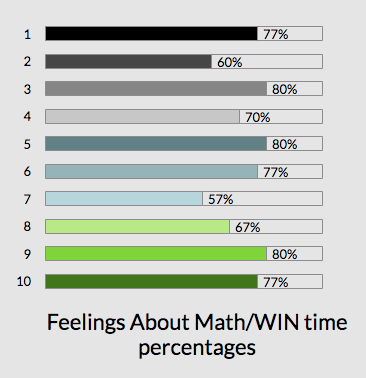
Each student was given an interest inventory to take via google forms. The interest inventory covered various areas of their thoughts and feelings about math, as well as how they like to learn math. I gave this interest inventory at the beginning of my study. My intentions were to give this exact same interest inventory at the end of my study, but unfortunately because of the Corona Virus, the schools all decided to close as a precautionary measure. I still used the data to help inform my teaching practices throughout my study, but it would have been interesting to see the students' thoughts at the end. On the graph to the right, I went through each of my questions and gave each answer a score. Never=1 point; Sometimes=2 points; Always=3 points. I did this because my questions were formatted in a positive/ I love math way. So the higher the score they got, the better off they were. These graphs do not include the open response questions I asked about what the students liked best about WIN time and what they disliked about WIN time.
Overall, the students had a fairly good feeling about math and WIN time.Most students were in the 20's score range. The highest score they could have gotten was a 30 if they liked everything perfectly. I had 3 students throughout my study that generally had a lower feeling about math than the others. Student 1, 7, and 8.
In order to calculate their feelings about math, I asked them questions in an always, sometimes, never format. and I assigned a number to the answer, as I mentioned above.
I formatted two different kinds of graphics to paint the whole picture on these students' thoughts/feelings about math/WIN time. I thought that would give me a clear picture on the students' needs, and help me to better instruct them and use specific instructional strategies for them to be successful.


Data set two: WIN time (PRE) & Common assessments (POST)
(MA 6.3.3.a) Determine the area of quadrilaterals, including parallelograms,
trapezoids, and triangles by composition and decompositions of polygons as well as
applications of formulas.


The next piece of data that I took for my study were 2 pretests and 2 post tests. These tests each focused on a different standard, but were both under the same geometry skill. At the start of my study I gave students a pretest based on standard 6.3.3.a (Left). We used a variety of instructional strategies, differentiation, and technology throughout the teaching of this skill until we reached mastery. We focused on this standard from 1/21/20 to 2/21/20 when I gave the Common Assessment (post test). The common assessments were provided through my district, and I reported those scores to our director of curriculum. For standard 6.3.3.a students had to answer both 8 questions on the pretest and Common Assessment (post test). In order to be deemed proficient, students needed to get 6 out of the 8 questions correct. As can be seen from the graphic representations, during the pretest 8 students were proficient, and 2 were not proficient. After the instruction occurred, the Common Assessments (post test) showed there were 9 students proficient and 1 not proficient. As it shows that the students improved or maintained their learning and skills, but not significantly. A paired-samples t-test was conducted to determine the effect of the specific instructional strategies used during WIN time to increase students’ math skills to meet the district’s priority math standards.There was not a significant difference in the scores prior to implementing instructional strategies (M=80.2, SD=19.59) and after implementing (M=85.2, SD=15.40) the instructional strategies; t(10)= 0.89, p = 0.19. The observed standardized effect size is small (0.28). That indicates that the magnitude of the difference between the average and μ0 is small. These results suggest that the use of specific instructional strategies used during WIN time had no effect on students’ math skills to meet the district’s priority math standards. Specifically, the results suggest that the specific instructional strategies used during WIN time increased math skills achievement.
The second pretest and Common Assessment (Post Test) focused on the standard (MA 6.3.3.b) Determine the surface area of rectangular prisms and triangular prisms using nets. My students focused on this standard from 2/22/20 until 3/10/20 when I gave the Common Assessment post test). Both assessments had 6 questions on them, and in order to be deemed proficient, students needed to get 5 out of the 6 questions correct. The graph to the left shows that during the pretest there were 3 students proficient, and 7 students not proficient. After the instruction was given, there were 5 students proficient, and 5 students not proficient. The number of students proficient went up, but not enough to say there was a huge improvement.A paired-samples t-test was conducted to determine the effect of the specific instructional strategies used during WIN time to increase students’ math skills to meet the district’s priority math standards.There was a significant difference in the scores prior to implementing instructional strategies (M=63.3, SD=21.82) and after implementing (M=76.8, SD=28.42) implementing the instructional strategies; t(10)= 3.22, p =0.00521. The observed standardized effect size is large (1.01). That indicates that the magnitude of the difference between the average and μ0 is large. These results suggest that the use of specific instructional strategies used during WIN time had a positive effect on students’ math skills to meet the district’s priority math standards. Specifically, the results suggest that the specific instructional strategies used during WIN time increased math skills achievement
(MA 6.3.3.b) Determine the surface area of rectangular prisms and triangular
prisms using nets.


Data set three: Prodigy


